Orange County Market Update October 2023
The Big Story
+7% Mortgage Rate Era
Quick Take:
The median home price in the United States landed 1% below the all-time high it reached in June 2022 after appreciating 13.6% in 2023. At the same time, mortgage rates are 1% higher than a year ago, which means the monthly cost of a home is 10% higher than last year.
The Fed hiked rates by 0.25% in mid-July to the highest level since 2001, which didn’t impact mortgage rates because the rate increase was expected. However, Fitch unexpectedly downgraded U.S. credit from AAA to AA+ on August 1 and, although we’ve maintained that 30-year mortgage rates would likely hover between 6% and 7% during 2023, the surprise downgrade may push mortgage rates slightly above 7% in the third quarter.
Broadly, the economy is doing well with strong GDP growth, high employment rates and job creation, falling inflation, and growing consumer confidence. Strong economics coupled with a low supply of homes have kept prices climbing, despite sustained elevated mortgage rates.
Note: You can find the charts & graphs for the Big Story at the end of the following section.
The average 30-year mortgage rate hit a 23-year high in September, closing the month at 7.31%. The current high mortgage rates are negatively affecting affordability, making it incredibly hard not to compare mortgage rates and prices to those of the past few years — because the comparison is so stark. In 2020 and 2021, 30-year mortgage rates were the lowest in history at an average of 3.11% and 2.96%, respectively. Low rates priced buyers into the market, which drastically grew demand in a market with fairly static short-term supply. Competition among buyers rose sharply, increasing prices at the fastest rate ever. The Case-Shiller 20-City Composite Home Price Index rose 41% from June 2020 to June 2022. Meanwhile, inventory plummeted, creating an even larger supply issue than the already undersupplied U.S. market. Although home prices contracted in the second half of 2022, as the Fed began hiking rates, they bounced back in the first half of 2023 and are now only 1.6% below the all-time high. Once we couple the median price with the average 30-year mortgage rate, we can see the actual monthly cost rather than just the price. Only 27% of homes were purchased with cash in August, a good portion of which were likely bought by homeowners selling their home and using the proceeds to buy another. Most buyers, however, are financing the purchase of their homes in some capacity and are, therefore, affected by the high mortgage rates. To put the change into perspective, the median home financed in August 2023 cost 15% more on a monthly basis than the median home financed in June 2022 — the all-time high price — because rates are 1.8% higher.
As you’ve likely already noticed, our current market involves an interesting dynamic of low supply and demand, but high prices and cost of financing. A lot of this has to do with (potential) seller mentality. Approximately 75% of U.S. homeowners have mortgage rates of less than 4%, according to JPMorgan, which has kept potential sellers from entering the market because they either stay in their home or keep their home as a rental property when they move. As a result, new listings remain significantly depressed. When we compare the first three quarters of 2022 and 2023 with the average from the first three quarters of 2017 to 2021, new listings are below average by about 1.5 million homes. The National Association of Realtors reported that the number of homes sold dropped 0.74% month over month and 15.3% year over year, which is less surprising considering that there are far fewer homes from which to choose. That being said, people move for all sorts of reasons, and supply has declined further than demand, which has helped prices stay high. Homebuilders are also affected by higher rates when it comes to construction loans, so homebuilder sentiment is in decline, according to the National Association of Home Builders/Wells Fargo Housing Market Index. We will likely see fewer and fewer new homes built until rates come down, negatively affecting supply.
Different regions and individual houses vary from the broad national trends, so we’ve included a Local Lowdown below to provide you with in-depth coverage for your area. In general, higher-priced regions (the West and Northeast) have been hit harder by mortgage rate hikes than less expensive markets (the South and Midwest) because of the absolute dollar cost of the rate hikes and limited ability to build new homes. As always, we will continue to monitor the housing and economic markets to best guide you in buying or selling your home.
--------------------------------------------------------------------------------------------------------------------------------------------------------------------------------
--------------------------------------------------------------------------------------------------------------------------------------------------------------------------------
The Local Lowdown
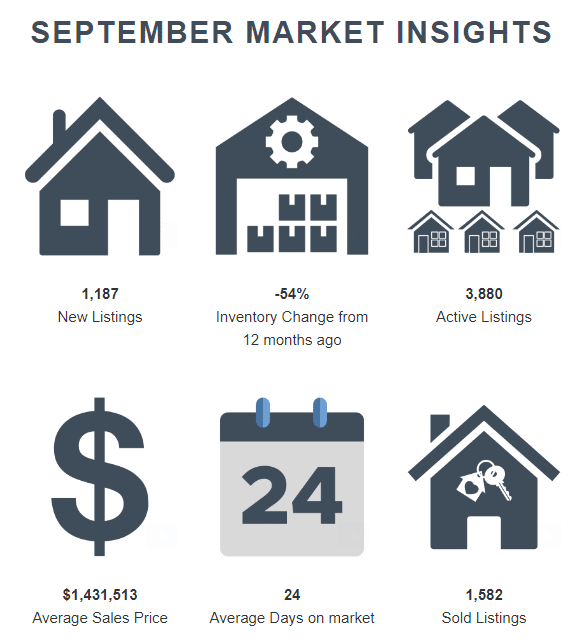
In Orange County, the price of housing is sticky — even reaching all-time highs during a period of rapidly rising mortgage rates. The median single-family home price rose 11% year over year, hitting a new record high in September. Condo prices fell from the August peak, still up 10% year over year. The sustained downward inventory trend and low number of new listings will create price support in the slower fall and winter seasons. New price peaks are exceptionally rare in the fall and winter, but we expect price stability for the rest of the year.
Typically, demand begins to decline in the fall and bottoms out in January, so the consistently low supply should be less of an issue. With mortgage rates at a 23-year high, quality listings are going to have the most competition. This isn’t unusual, but potential homebuyers aren’t nearly as willing to pay a premium for a fixer upper as they were in 2020 and 2021.
Months of Supply Inventory (MSI) quantifies the supply/demand relationship by measuring how many months it would take for all current homes listed on the market to sell at the current rate of sales. The long-term average MSI is around three months in California, which indicates a balanced market. An MSI lower than three indicates that there are more buyers than sellers on the market (meaning it’s a sellers’ market), while a higher MSI indicates there are more sellers than buyers (meaning it’s a buyers’ market). MSI fell below three months in the first quarter this year and has hovered around two months of supply from March through September. Currently, MSI indicates the housing market in Orange County continues to favor sellers.
Please Get In Touch
Explore the places, neighborhoods, and people that make the communities we serve special. We’ve highlighted important market data, school information, and neighborhood highlights to help you find your new home.
Stay up to date on the latest real estate trends.

Seasonal Inventory Declines and Price Stabilization?

July 2024

Coastal Splendor: Explore Exquisite Waterfront Properties in Orange County Orange County's coastal charm is epitomized by its stunning waterfront properties, each off… Read more

The Role of Schools in Orange County Home Values: Unraveling the Correlation Between Education and Property Investment In the intricate tapestry of real estate, vario… Read more

Historic Homes in Orange County: A Journey Through Time Embark on a captivating journey through Orange County's rich history as we explore the charm and elegance of i… Read more
Happy Wednesday to you all and sorry to get this to you about a week later than normal. Spring break with the kids, busy listings, and life got in the way. So without … Read more
Well its the begining of "listing season" but where are the homes? Long story short, they are coming but its probably going to be a bit. The market is starving for inv… Read more

The 9 Best Neighborhoods to Live in Orange County