Leave a Message

Thank you for your message. We will be in touch with you shortly.

July 2024 Orange County Real Estate Market Update

July 2024 Orange County Real Estate Market Update
 

The Big Story

Median home price hits record high for the second month

Quick Take:
  • Since January 2024, prices have climbed 13.6%, reaching an all-time high in May and another in June 2024. Similarly, the monthly cost of financing has hit a record high, meaning that home affordability is at a record low.
  • In June, the average 30-year mortgage rate declined to 6.86%, dropping 0.17% from the 2024 high reached in April. The Fed may cut rates as early as September, but the magnitude of the cut will be small, likely 0.25% this year. Currently, we expect rates to remain between 6% and 8% for the rest of 2024.
  • Sales fell 0.7% month over month, while inventory rose 6.7%. The combination of rising prices and high interest rates has kept sales historically low. Since January 2023, sales have trended more horizontally, although we expect sales to decline until spring 2025.
 
In June, prices rose for the fifth month in a row, peaking at an all-time high in June 2024. This also marks the 12th consecutive month of year-over-year price growth. According to typical seasonality, the median price peaks in June, so we expect prices to decline starting in July. Over time, prices generally move much higher in the first half of the year than they decline in the second half; you can think of it as two steps forward and one step back, year after year. Last year, for example, prices rose 13.7% from January 2023 to June 2023, then fell 7.7% from June 2024 to January 2024, which was still a year-over-year gain of 4.9%. This year will likely look similar, although we don’t think that prices will decline as much in the second half of 2024 as they did in 2023, especially if the Fed cuts rates in the fall. Even a minor rate cut, like the expected 0.25%, could significantly affect mortgage rates, as it would signal the beginning of more and more cuts.
 
 
For the moment though, we are starting summer with a combination of elevated mortgage rates and record high prices, which have brought affordability to an all-time low. Low affordability has resulted in fewer sales and growing inventory. Demand is still high relative to supply, even though inventory is building. We know that demand is still high because buyers are still buying at peak prices. From a historical context, we should’ve expected this to happen. We took a look at data from the 1980s to see how much home prices appreciated during a decade-long period of the highest mortgage rates in history. From January 1, 1980, to January 1, 1990, the 30-year mortgage rate ranged from 9.03% to 18.63%, with an average rate of 12.71%. Although home prices didn’t increase dramatically like they have in the recent past, inflation-adjusted home prices still increased about 8% during that decade. Today, with the strong U.S. economy, it was never very likely for home prices to stagnate or decline due to higher mortgage rates. However, high rates have slowed sales volume considerably, which has caused inventory to grow.
 
 
Overall, inventory growth is great news for the undersupplied U.S. housing market. According to data from the National Association of REALTORS® (NAR), inventory reached its highest level since August 2022. The market is still broadly undersupplied, but the increasing inventory level should cause rising home prices to slow. In the pre-pandemic seasonal trends, sales, new listings, inventory, and price would roughly all rise in the first half of the year and decline in the second half of the year. Sales and new listings have been far lower than usual since mortgage rates started climbing, which is to be expected. Because we don’t anticipate sales to pick up until the spring of 2025, inventory could continue to grow in the second half of the year.
 
 
Different regions and individual houses vary from the broad national trends, so we’ve included a Local Lowdown below to provide you with in-depth coverage for your area. As always, we will continue to monitor the housing and economic markets to best guide you in buying or selling your home.
 

The Local Lowdown

Quick Take:
  • The median single-family home price declined slightly from the all-time high reached last month. Month over month, prices declined 1.4% for single-family homes and 0.3% for condos. We expect new highs for single-family homes and condos in June, since both are only 1.4% and 1.9% below their peak prices, respectively.
  • Active listings in Orange County declined 1.0% month over month, as both sales and new listings fell. A drop in inventory and new listings is likely an early sign that inventory will remain incredibly tight this year.
  • Months of Supply Inventory fell below three months of supply in February, and remained near two months of supply in June, indicating the market favors sellers.

The Median Condo Price Reached a New All-Time High

In Orange County, home prices are just below record highs for single-family homes, while condo prices hit an all-time high. Persistently low inventory and high demand have more than offset the downward price pressure from higher mortgage rates. Prices in Southern California generally haven’t experienced larger drops due to higher mortgage rates. In April, the median single-family home price reached $1,425,000 — a new record high — before falling 1.8% from April to June. Prices typically peak in the summer months, indicating single-family home prices could possibly rise to a new high in July or August. Additionally, inventory is so low that it will create price support as supply declines in the second half of the year.
 
High mortgage rates soften both supply and demand, but home buyers and sellers seemed to tolerate rates above 6%. Now that rates are near 7% again, sales are slowing during the time of the year when sales tend to be at their highest. This phenomenon isn’t great for the market, but it isn’t terrible, either, as it may allow inventory to build in a massively undersupplied market.
 

Inventory, Sales, and New Listings Fell in June


Single-family home and condo inventory, sales, and new listings fell in June. A 1.0% inventory decline is small, but meaningful during the time that inventory builds most quickly during the year. Total inventory trended down from August 2022 to March 2023, as far fewer listings came to the market, before stabilizing from March 2023 to the present at a depressed level. Low inventory and new listings, coupled with high mortgage rates, have led to a substantial drop in sales and a generally slower housing market. Typically, inventory begins to increase in January or February, peaking in July or August before declining once again from the summer months to the winter. In 2023, inventory patterns didn’t resemble the typical seasonal inventory peaks and valleys.
 
In the beginning of 2024, we were hopeful that inventory and new listings would resemble historical seasonal patterns. However, new listings haven’t come to the market in the quantity needed to bring a significant increase in inventory. The number of new listings coming to market is a significant predictor of sales, and buyers simply aren’t able to buy homes that aren’t for sale. The demand in Orange County is there, but supply — especially new supply — hasn’t come to the market. Now that we’re halfway through the year, it’s clear that supply will remain tight until spring 2025 at the earliest.


Months of Supply Inventory in June 2024 Indicated a Sellers Market

Months of Supply Inventory (MSI) quantifies the supply/demand relationship by measuring how many months it would take for all current homes listed on the market to sell at the current rate of sales. The long-term average MSI is around three months in California, which indicates a balanced market. An MSI lower than three indicates that there are more buyers than sellers on the market (meaning it’s a sellers’ market), while a higher MSI indicates there are more sellers than buyers (meaning it’s a buyers’ market). MSI has been below three months for most of the past 12 months. Since January 2024, MSI has declined significantly. Currently, MSI implies a sellers’ market for both single-family homes and condos.
 
 
If you have any questions or want to contact David Feldberg reach out today!

Recent Blog Posts

Stay up to date on the latest real estate trends.
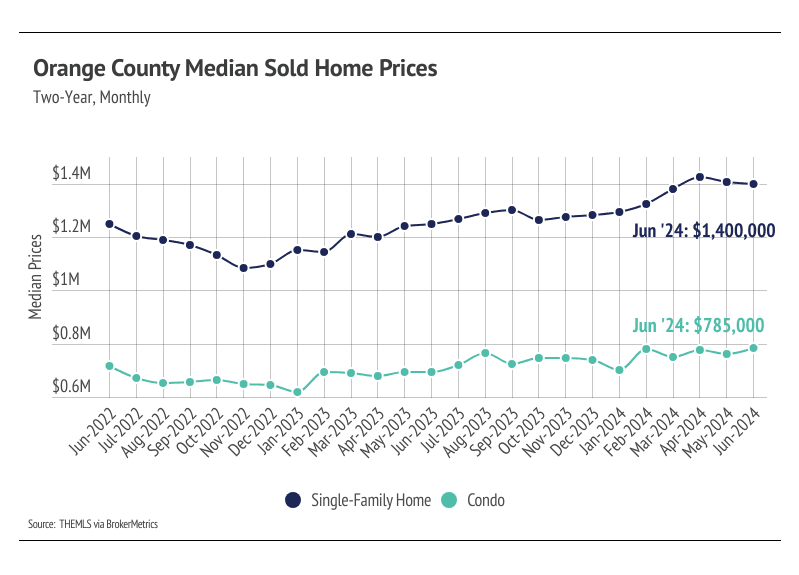
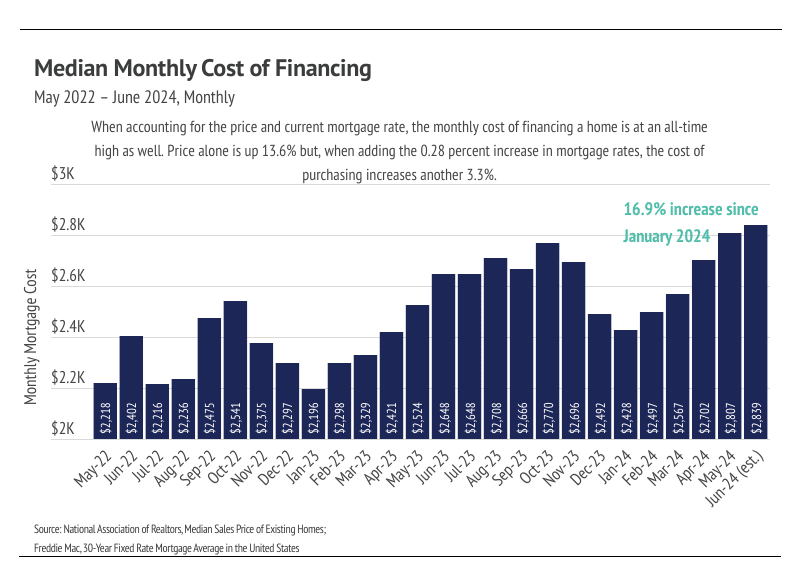
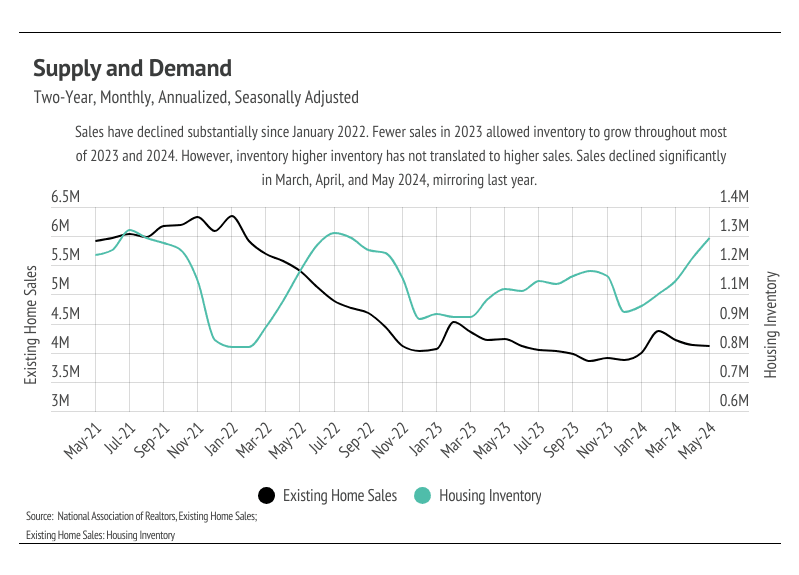
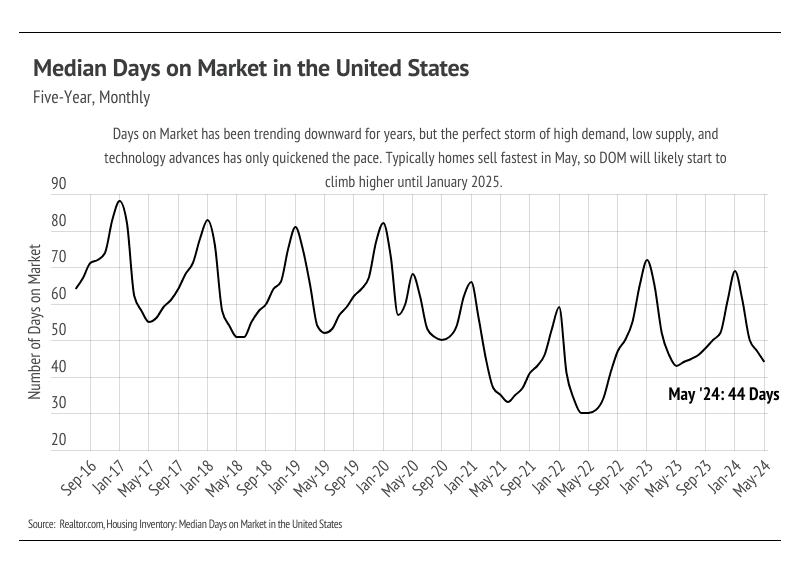
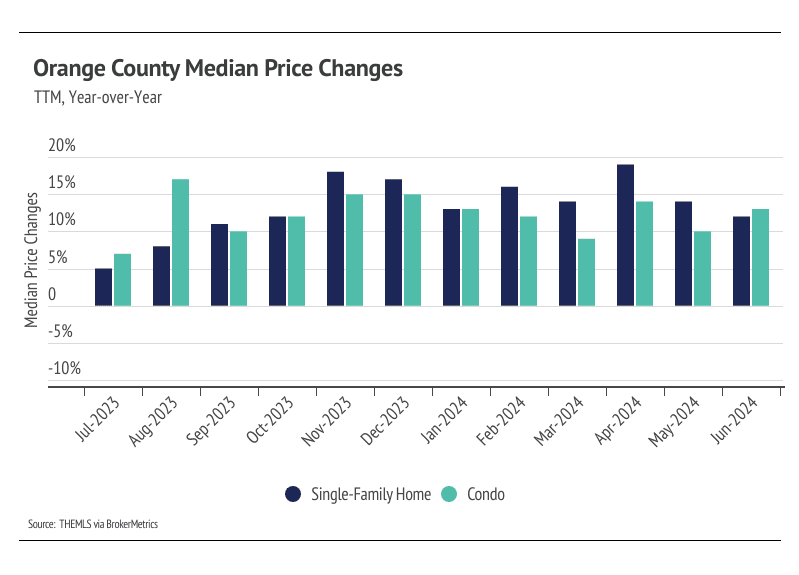
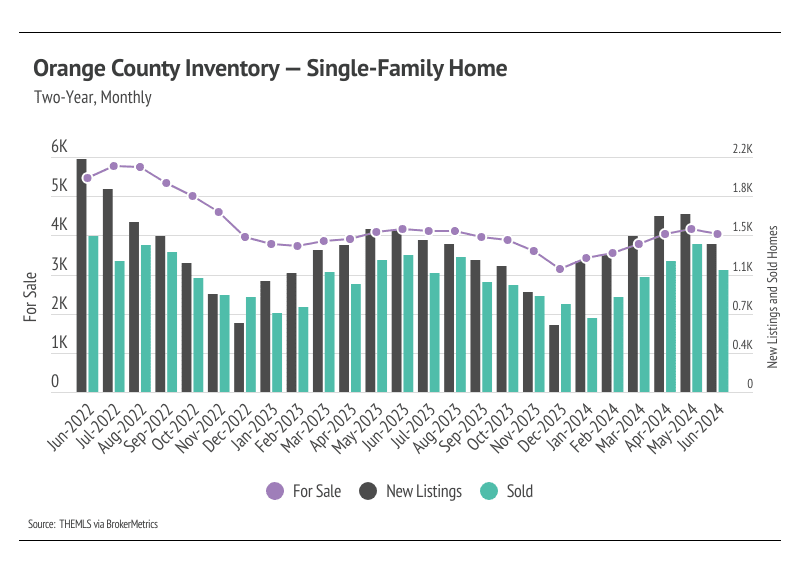
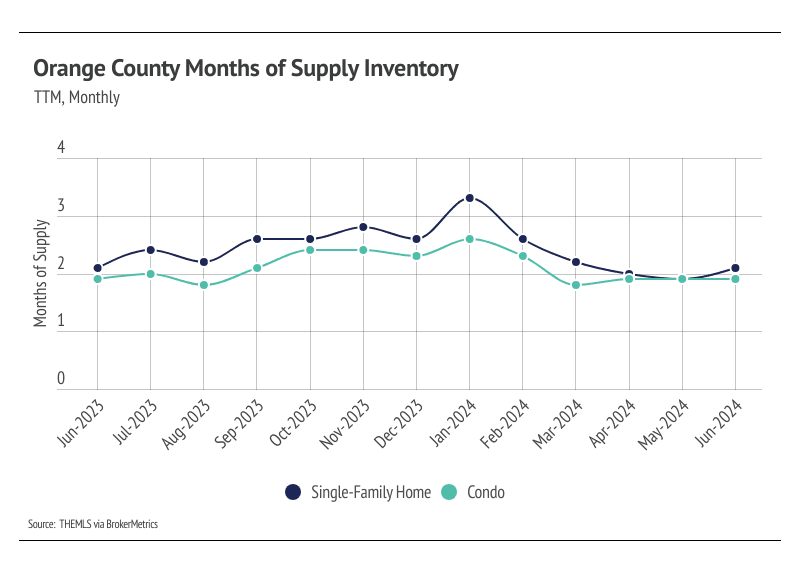
July 2024 Orange County Real Estate Market Update

July 2024

Exploring Waterfront Properties in Orange County

Coastal Splendor: Explore Exquisite Waterfront Properties in Orange County Orange County's coastal charm is epitomized by its stunning waterfront properties, each off… Read more

The Role of Schools in Orange County Home Values

The Role of Schools in Orange County Home Values: Unraveling the Correlation Between Education and Property Investment In the intricate tapestry of real estate, vario… Read more

Historic Homes in Orange County: A Journey Through Time

Historic Homes in Orange County: A Journey Through Time Embark on a captivating journey through Orange County's rich history as we explore the charm and elegance of i… Read more

Orange County Market Update March 2024

Happy Wednesday to you all and sorry to get this to you about a week later than normal. Spring break with the kids, busy listings, and life got in the way. So without … Read more

Orange County Market Update February 2024

Well its the begining of "listing season" but where are the homes? Long story short, they are coming but its probably going to be a bit. The market is starving for inv… Read more

The 9 Best Neighborhoods to Live in Orange County

The 9 Best Neighborhoods to Live in Orange County

Orange County Market Update December 2023

The Big Story Fed policy is working, but mostly just on housing Quick Take: The national median home price declined 3.8% in the third quarter, landing only 4.7% belo… Read more

8 Awesome Places to Watch the Sunset in Newport Beach

As the sun begins its descent, Newport Beach transforms into a canvas of breathtaking hues. Join us on a journey through eight incredible spots, all nestled within the… Read more

link